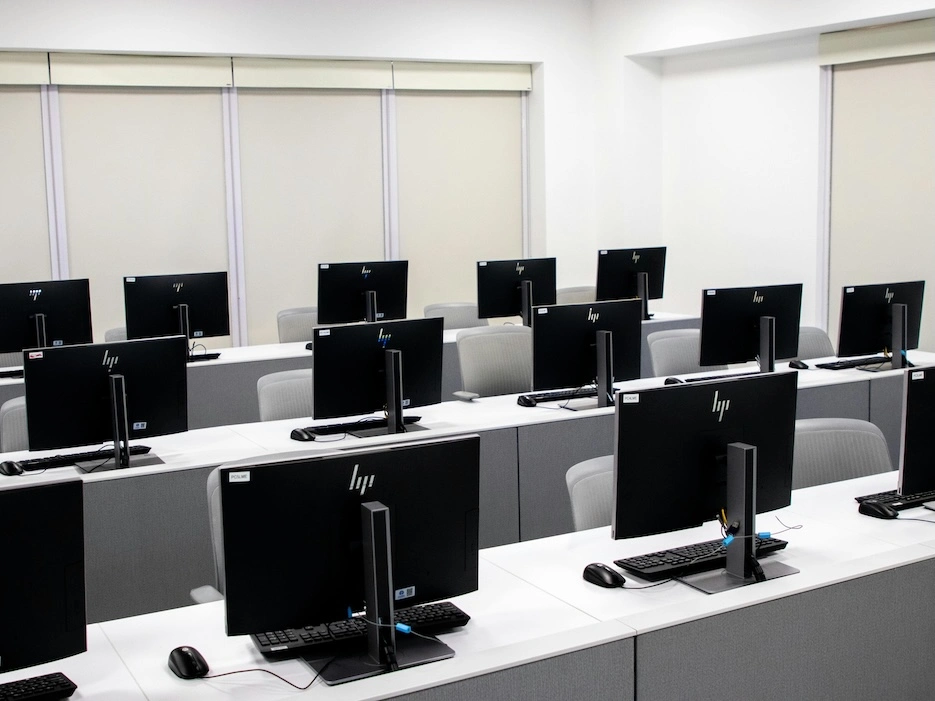
Nexthink provides the university IT management team with big data and end-user insights. Whilst most monitoring services focus on the backend (things like servers and networks), Nexthink provides specific and real-time information relating to the end-user.

For universities and community colleges, this approach provides an amazing insight into the students' (and staff's) IT experience.


End User Insights for Universities - Webinar Transcription

I won’t spend too much time on PowerPoint and I’ll actually show you the tool. But I will give you a little bit of background to why we’ve adopted this product. We’ve been doing this for over 6 years and obviously we only ever work in the academic market—that’s our main focus. But what’s been going on really in the U.K., we’ve got now around 50% of the application market use Application Jukebox. So for AppsAnywhere to continue growing, there is two things we can do. Obviously one of those things is to sell into new territories. So as you’re aware, Leon has been around now for a while and he’s been selling it to Europe, extremely successfully around Spain, where he now lives. But we’ve also got implementations now in Belgium, Denmark, Norway, so he’s doing a very good job of making Jukebox available out there.

We obviously expanded into America as well, so in America, we’ve now been basically doing this around a year. We’ve got around 10 customers now in the U.S. and that was mainly around Application Jukebox. But the other thing we can do as a company is take on additional products, and quite a lot of time over the last number of years, partners have come to us and asked if we would sell their product. Most of the time we would say no but over the last couple of years, we have come around some really interesting and cool products that we really like the look of.

Nexthink in the U.K., they work through partners, but in the U.K. they have recently sold to a couple of universities. They’ve sold to the University of Bedfordshire, which is a large university just outside London, the University of Manchester, which is the largest university in the U.K. It’s got around 40,000 students. And they’ve also sold to Darby University. And I think one of the things they’ve most recognized is that the education space is a really good market for them. It’s not something they’ve looked at before. They spoke to Darby and said, “Who should we partner with?” Darby, also a customer of Application Jukebox, said, “You should chat to AppsAnywhere.” So the guys came, they demonstrated to me the products after a presentation, and basically I was just blown away by it. We weren’t really looking for an additional product at that time exactly—we had just taken Scense on—but it was such a good product that I said we have to take this to the education market. The fit is fantastic, the benefits are aligned with what educational institutions are trying to achieve, so that’s where we are today. We started selling this around February/March time. We’ve got around 6 customers in the U.K. already and we’re just about to sign up our first in the U.S. as well, so I expect this to be a product that’s interesting to everyone really because it’s pretty cool.

If I tell you what it is, it’s all around service delivery and the challenges you face around delivering your services. So you’ll be aware that it’s not getting any easier. Service delivery, in an education context, is getting harder all the time and it’s because of the huge variety of different environments you have to cater for. How you will manage those services, you will have services that are on premises, whether that is e-mail, or something like ERP, but you’ll also have web services as well, whether that’s a VLE or maybe some kind of accountancy, anything. You will have web services that are delivered into your environment. And they’re also being delivered into an environment that is also diverse. Sometimes it may be physical, sometimes it may be virtual. And a lot of the users that are consuming these services aren’t always on-site either. A lot of them could be mobile with laptops, etc.

Nexthink is about looking at service delivery but from an end user perspective. So it’s actually called end user analytics. If you subscribe to the Gartner thought base, Gartner called this topic IT operations analytics. Within this topic, Nexthink are a vendor, and they’re also a unique vendor because there is nothing else in the world, as far as we can tell, that does it from this perspective. A lot of Gartner’s research looked at IT operations and they came up with these statistics. It’s pretty logical that most of the problems you face arise from the end users. In the end user analytics world, Nexthink is really the only product that does it. You will be aware of products that monitor networks, and you’re aware of products that monitors a service, but nothing looks after the end user’s stake and that’s the gap Nexthink is trying to plug.

What does it do? Effectively, as an organization, you deploy what they call a collector. This collector sits on every end point device. Those end point devices could be Windows machines or Mac machines, it doesn’t really matter. It runs as a passive driver and it collects up to 700 different, relevant events that happen on end user devices. There’s no configuration of that collector. It’s self-learning. If you install something on there, it will monitor it. Everything that goes on, on that end user device, is monitored. Every connection it makes, every execution that is made, every crash, every slight bit of information, whether CPU, RAM, disc usage—everything you can imagine. And that’s all reported back to a centralized engine, which basically provides a facility to do real-time analytics. Look at incidents. When you’ve got incidents that affect one person, how many other people do they affect? How many other people have seen that incident and what is the scale of incidents? So if we’ve seen one come in, is this going to affect thousands of people or is it isolated? If it does affect thousands of people, how can we be proactive and fix it before it becomes a problem? The engine is there to provide that and then what Nexthink provides you with is two tools to analyze that data. The first tool is called “the finder.” That’s where we go investigations. That’s looking at your services, looking at your root cause analysis, maybe looking at individual anomalies and abnormal individual behavior that’s going on, investigating what’s going on and being able to come up with a solution for it. And then you’ve got a portal, when you’re really interested in dashboards around how your services are running, IT governance, around green IT, or security, higher information, then you can use the finder tool to investigate.

So the different areas we’re covering with Nexthink, the first one is what it was designed for. It’s called proactive problem management. Taking one person’s issue and fixing 1,000 people. So if Leon is the ticket in the help desk, and I go investigate and found out there’s another 999 people who could get this issue, I could fix it for all 1,000 people and save myself 999 tickets into the help desk. It’s only by doing it by the end user that you get this kind of perspective. The end user’s traffic goes from end point to end point, all the way back and back again. That’s true of web services, as well as internal, physical services. It gives you what you can see below, these unique, visual, end to end maps of the traffic and the data. That allows you to do some root cause analysis and maybe not help you find out what it is, but at least help you find out what it isn’t. And that is where problems actually lie.

Problem management is the big area, this is where it was developed, this is what it was designed to do. But because we monitor so much information from an end user device, we get effectively what I would call positive side effects. The firs one is around real-time breach detection for security. I was just at a Nexthink baseline service report this morning at Gateshead College and we found 3 devices running a browser called TOR.xe. I had never heard of it but apparently it is a big security risk. This browser’s kind of the root to the dark internet where all traffic is hidden and anonymous, but we found that in Gateshead’s environment whilst doing a check and these are the kinds of things that are picked up by your anti-virus: P2P, Tor, uTorrent, we found on their network—all those kinds of things going on. And it will also do a check against the virus scans as well. They had a number of executables running on their devices, which their anti-virus hadn’t even realized was a threat. But on the virus total, it was showing as an actual threat. So it’s another line in the defense from a security perspective. Many of the larger defense ministries are now using Nexthink. Their biggest customer is the Ministry of Defense in France, where the total of 50,000 end points are checked. They found some traffic going to Kazakhstan, which they thought was a little bit weird.

The other side effect is around transformation projects. Obviously, if you can look around all the devices, you can start looking at benchmarks, so any kind of transformation you’re taking, we can start benchmarking those. Oxford Books in the U.K. are just about to do a network refresh. They’re going to put Nexthink in now so they can benchmark it now and prove the benefits of what they’ve been doing afterwards. You can also look at this from a perspective of a hardware refresh. Sheffield University are one of the big boys in the U.K., 15,000 devices. Every year, they replace 5,000 those devices on a rolling project. This costs millions of pounds. Using Nexthink, they’re going to get all of the data out of those machines and set tolerance levels, saying, “We only need to replace 3,000 of those machines, 1,000 can be rebuilt and be redeployed, and another thousand just need a RAM upgrade.” They’re looking to save 20% annually on their hardware refresh. So those kinds of things are big ticket numbers when it comes to education and being able to do it.

I’m just going to give you a little bit of information on Nexthink. They’re a company from Switzerland. They started 2004 out of a project, EPFL. That IT project was actually marked by the CIO of Rolex. He said, “If this was a commercial product, I would buy this,” and a couple years later they released it as a commercial product and the first customer was Rolex. Rolex still use it today, even 10 years on, for their end user analytics. As you can see, over a significant period of time, they’ve built up a large customer base. They’ve actually got around 500-600 customers now, so this slide gets out a day every month. It’s extremely fast growing technology, but as you can see kind of typical return on investment people are seeing is a 60% faster problem resolution. By having the visual maps, getting to the end point and the cause is a lot quicker using Nexthink. All this data probably exists for you but it could take 3 or 4 days, sometimes months, to find out you’ve got a problem with a proxy. Nexthink can show you that very quickly. Obviously around the IT transformation, you can look at savings on the projects there like the hardware refresh. Being proactive in your problem management in your help desk can lead to significant reductions in incidents. The majority of customers actually receive about 30% reduction in incidents at their support desk within the first 9 months. Universities we speak to in the U.K. that have around 20,000 students, they get around 3,000 students a month coming into their help desk. If you can reduce that by 30%, that’s a significant change, and that’s just by being proactive and solving multiple people’s problems just from one issue coming in. As we all know, most people don’t even report the issue.

The first thing I’m going to show you is the Finder. I’m going to take you through a couple of examples and then from the Finder, I’ll take you through to the portal and show you some of those dashboards. This is my Nexthink Finder. Let me just show you a few quick things on the screen. First I have the statistics, which is just the environment in which the engine is looking after. So number of users, devices, binaries being run, destinations hit, domains that have been hit, and how many printers are hooked up to this. So as you can see, it’s quite a sizable environment within this demo. One of the things I might want to do is look at comparisons within there. Again, I can have a quick look at all the machines with the different numbers of RAM in there. Again, at Gateshead this morning, we were presenting our findings for the Nexthink service. They were surprised how many computers they had with less than 2GB of RAM. Then we’ve got useful things like average logon duration. You might have certain KPIs where you say any machine that people login to has to boot up within a minute. Then you can start investigating and drilling down into all the machines that take 5 to 10 minutes. What’s common in all those machines? One of the things at Gateshead this morning, the guy had been using that to investigate and he found there’s all sorts of problems with Word and Internet Explorer when people started up their machines, which is really bizarre. So he was able to shut all those programs down, stop them from starting up, and increase the time to logon. There’s quick things you can do there in terms of device companions. The search at the top here is very clever where you can just start typing in the word, something like “Excel,” and then we can pick from the investigations built into the system to say, “Show me any device with performance issues due to Excel.” Then it will show you all the devices, you can look at the hardware on the devices, and all those kind of things. These searches can be used for anything you want, who’s using Google Chrome, who has laptops, anything you want.

One of the things we do setup within Nexthink is around the services. If I quickly look at the categories, we can define all the different services that you have within your own environment. As you can see here, we’ve got 3 different exchange servers and all you do is tell it what your server IP addresses are, and then anything that connects through them is monitored through Nexthink to look at whether it’s working or whether it is up and running, etc. Once you’ve got the services set up, you can easily create investigations. Things like this in Nexthink are not just for technical people. You don’t have to have a degree in computer science to be able to do this. They’re very object orientated, you can build your investigations with very simple training—it’s not just for technicians. Nexthink will and should, in the long-run, impact most of your organization, even including departments you would never expect like HR and things like that.

But a service is what it’s monitoring, so let me show you what an actual service looks like. This is my SAP service, this is a web service. I can see how many application crashes we got, some metrics along there, the different locations we have. So when we build and setup Nexthink in an environment, we create an organizational map of that environment as well based on the ideal locations, or buildings, or even rooms if that’s the level of detail you want to go to. But there will be a logical organizational structure built into Nexthink. Red means issues, so I can see that we’ve got Paris, they are having issues connecting to the staff service, and then when London comes on stream, I get this scenario where I have 48 devices with errors. Also, the red bit below it is the benchmark against last week, so I have 48 more problems than I had last week. This is where it gets clever. I can have a look at web activity and this is all the traffic associated with that SAP service. I can see the different locations. You can collapse them or look into the users’ devices. I can see the different binaries they’ve been using. As I said before, this is SAP service. It’s a web service using Internet Explorer to get to it. We can see what port it’s on. I’ve got a number of different proxies, internally, and I’ve got the end device, which is obviously a SAP domain. Now if I want to look and see what the problems are, let’s look at the failed web requests. This will give me a very different view of that world. Now I can actually see that I don’t have any problems at all in Dubai or in New York, but where I’ve got problems in Zurich, London, and Paris, there is one common problem with all of them. They’re all going to this proxy here, so instantly, we create a scenario where people can collaborate together. We haven’t got the network team blaming the apps team, or the apps team blaming the network team. It’s quite clear that we’ve got a problem with the network and the proxy. It’s not always going to show you this, it’s not always going to be as clear as this, but most of the time, it’s going to help you narrow down where the issue lies. I can do what we call a one-click investigation between all of the users that has impacted. This is all of the users. If you choose to link this to active directory, I can put the active directory information in there as well, so I can actually see the names and their roles and titles. Interestingly and importantly, if it is a SAP service, that is likely to impact finance, so I might want to pick some VIPs within my organization and make an e-mail. So Anna Hugh, she’s the finance CFO, I could send her an e-mail and say, “We know SAP’s down, we’ve got some issues, but we know what the problem is and we’re going to fix it.” You might want to tell all of these people there’s a problem with it. You can very easily do that with Nexthink but it does even have the concept of VIP, so you can actually set up individuals up that you want to monitor closely to see if they do have issues, and be alerted to the. And then you may be able to fix problems for these VIPs that they never even knew they had. There’s another service I just wanted to show because I think when it’s network-driven, it’s often quite obvious but I like this service example here. This is ERP and unlike SAP, this is network activity because it is an internal service, but just the same as with the web one, I can see all my failed connections from all the locations. They’re going to one specific binary, so being a local service, Internet Explorer can connect to the ERP. There’s a version here, 1206680, which has no problem connecting but the old version of ERP, 1206510, has an issue with it. So it’s not a network problem, it’s an application problem. You may find these kinds of things when you’re doing your IT transformation project, when you start rolling out a new version of something, if you start getting failed connections, you can roll it back. Do we want to do a one-click investigation to all the devices and then maybe select all those devices and send it as an export collection to SCCM, where you’re going to say, “I want them all upgraded to the latest version of ERP.” It won’t fix the problem for you but it does give you some tools to be able to do that. It’s more about nailing down where the issue actually lies. Rather than spending days or months doing that, it’s finding it very quickly.

One of the things I want to quickly show is this obviously has an impact on support, so I’m going to quickly go to a bookmark. You may want to integrate this with your help desk or whatever you use for incident management. This is example of an integration with a tool called Service Now. What they’ve built with Service Now is integration where they have an additional tab within their support desktop. And you can quickly just drill down, see this machine the previous week had all sorts of issues, some of which have already been fixed. But we still have a problem here with our PC health. I can see here we still have high CPU usage and we had high CPU usage last week. Clicking on that link there will take me to that machine now, a completely different view—an individual machine in Nexthink. This is where you describe it. It’s like having a support analyst sat over the shoulder of every machine in your environment. You can see basically not a snapshot, but a video, of everything going on in that machine. The gaps here are where the machine is off. The gap here is where it’s idle. Idle time can obviously be used around green IT, inactivity on a night, and those kinds of things. But this machine had problem with the CPU. I can see a warning here. If I hover over that, I can see the problem has come from Internet Explorer. So one of the things I might want to do is zoom out. And as I say, it’s a video of what’s been going on on that machine. I can zoom out to an appropriate timescale and then look back in time and find out when the problem started. I can see we don’t have any problems at all until here, when the high CPU usage starts on the 3rd of December. At the same time, I can see we’ve had some activity: two packages were installed, a KMPlayer and an Ask.com toolbar. It doesn’t take a genius to figure out the toolbar is going to be the cause of our problems. Again, I can have a look at that, drill down, show me all the devices that have got the Ask.com toolbar on. Then seeing that information, I can do the same job as before. Let’s get rid of it, send the job to SCCM to remove it. Again, this is a small example of taking one person’s issue and fixing it for multiple people. It’s all about proactive problem management. There are several different support desk tools that have been integrated with Nexthink, but if it hasn’t been, there is open APIs for Nexthink available for us to build upon. So anything that you have, we can build upon an implementation.

The other thing I touched on was it having an impact on security. We do provide alerts if there is things that have been detected. One of the alerts here is about dangerous activity and if I select that, I can see I’ve got a number of devices that are reporting dangerous activity. I’ve got a one-click investigation just to look at dangerous binaries and I can see there’s an executable there called “sendme.exe,” that reports to be Visual Studio. And if I want to have a look at what’s going in terms of the web activity of that, I can see these devices have installed with these users and at the bottom I can see what’s going on here. This is uploading packets of data, 4MB using sendme.exe, via port 80 to an external destination, which is a one drive. So every half an hour, on every one of those people’s machines, sendme.exe is uploading data to an external one drive. That’s suspicious behavior that might need further investigation. You might want to go have a look at it. You can have a look at your virus definitions to see if they’re out of date. I might just have a quick look in that binary on virus total. That will take me to virus total—I think it’s 55 different anti-virus vendors that subscribe to virus total, and you can check the executables under “binary.” And you can actually see quite a few anti-viruses haven’t yet discovered this is a problem binary. So even if your anti-virus isn’t quite caught up yet, it’s about getting it as early as possible when it comes into your environment. With the subscription to virus total, you can very quickly get access to that.

I will then show you the final piece. This is the portal. The portal starts its life when we do the install, as a completely blank database. Then we will build portal reports based on the information you want that is collected from Nexthink. It could be all sorts of different things and reports that you want to be put in there. You can choose different dashboards and widgets from a library. There’s some standard ones you can choose and add. There’s a Nexthink library that’s online and those people build new reports from all the data. You can choose and pick some of those as well. Of course, bespoke ones can be built for your requirements. It’s an empty database and that gets populated from the engine on a daily basis. Information in the portal is not real-time; information in the Finder is real-time. We do define some business critical services that are captured real-time. Here, these are all real-time captured services, so you can see where we had problems with the SAP. This is the kind of thing I expect to see on the wall in the service desk. What’s going on in the environment when you start seeing connection problem, proactively going out and sorting it out before the red phones of panic start coming through. You can also look at things on this dashboard. We’ve got all sorts of things, Security, I think I mentioned a few things like abnormal binaries, all sorts of things like that. So it was BetFair in the U.K., actually. They thought that 10% of their users had admin rights and it turned out 10% of their staff had admin rights. That in itself is a breach. The guy at Gateshead—he was really keen on all the different Java versions that are out there. They had 70-something different Java versions that were being used and they didn’t even realize that was going on in their environment. I think one of the things I got from this morning, I said I think we’ve got about 5 customers now but they’re all going through an NBS. It’s the first final presentation and it’s amazing what is going on in someone’s environment that they didn’t know about. It was fascinating to see.

You can use the IT governance for your software usage. This is Microsoft, but it could be any one of them. Gateshead had a massively over-subscription to Adobe. They don’t need as many licenses as they’ve got. You can see things here, like Visio is installed on 51 machines but it’s never been used on 42 of them, so only 9 of those have ever been used. All that information can be collated across your entire estate as well. You’ve got nice things around policies for turning machines off in the night. You can find out which people are turning them off, which people aren’t. Many people will have a look at this might have specific things in place that’s supposed to switch the machines off during the night. Most of these NBSs—they’re finding out that even they aren’t working. So it’s about maximizing the investment on some of those other tools you may have. At Gateshead, only 1% of jobs were duplex, which is crazy given the amount of paper that’s used in printing in college. On the transformation side of things, I like the VDI stuff because I think it’s quite geeky. They’ve used all the data they’ve collated across their customer base over the last 10 years and come up with a VDI readiness index, which I think is quite fascinating in terms of how capable you are of utilizing VDI across the different environments and people that you’ve got. Some nice little graphs around user experience and technical savings you could make, but also around capacity planning as well—I think this is quite important. It’s taking the actual usage, your actual data, in terms of the processes that’s being used, the RAM, the hardware, the hard disk drives, the bandwidth, and it will start giving you capacity planning for your VDI. You can start having a look at that in term of how much you need in terms of disk space. It’s not just average or maximum, but what your potential is if all your people go on there. Remember the portal is just about defining and building reports that are relevant to you. I’ve mentioned a few times the NBS, that stands for Nexthink Baseline Service. It seems to be very popular in the U.K. with what people want to do, in terms of having a look at Nexthink. Most people, myself included, would probably call it a POC, but you actually get something out of it. If you choose to go with Nexthink, it’s fantastic—you’ve got a setup in place. If you don’t, you’ll still get a 70-page report about your environment, and that’s what we were basically presenting at Gateshead this morning that showed them all of these different things. Depending on your engagement within the NBS, we normally build a number of return on investment proposals that can be used. You get something out of an NBS, which is basically putting a collector on up to 5,000 devices, letting it run for 60 days, and presenting back the findings of that. But they’re also letting you play with the Finder and portal during that time as well.